

echarts实现心电图(实时和长图滚动)
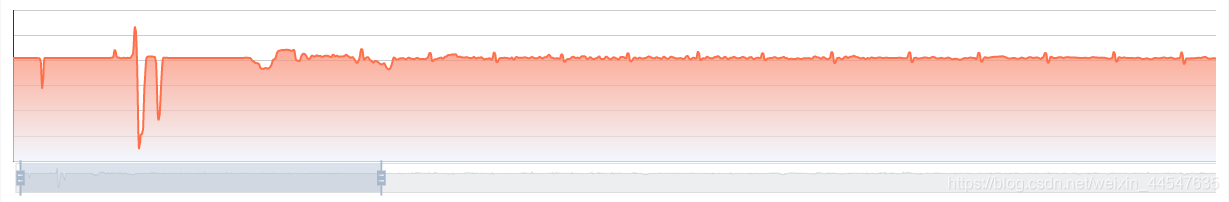
长图滚动条
var totalFlowRateOption = {
grid: {
  left: 0/*"50px"*/,
  right: 0/*"15px"*/,
  top: 0/*"15px"*/,
  bottom: 39/*"15px"*/,
  borderWidth: "0"
},
xAxis: {
  boundaryGap: false,
  data: xAxisData,
  show: false
},
yAxis: {
  boundaryGap:false,
  splitLine:{show: true}/*网格线*/

},
dataZoom: [{
  type: 'slider',
  show: true,
  xAxisIndex: [0],
  start: 0,
  end: 30, //初始化滚动条
  textStyle: {
    show: false
  },
  backgroundColor: '#fff',
  showDataShadow: true,//是否显示数据阴影 默认auto
  showDetail: false,//即拖拽时候是否显示详细数值信息 默认true
  handleSize: 35,
  startValue:3000,
  endValue: 5000
 }],
 series: {
   /*itemStyle: {normal: {areaStyle: {type: 'default'}}},*/
   itemStyle: {
     normal: {
       lineStyle: {
         color: '#ff6f4a'/*折线的颜色*/
       },
       color: "#ff6f4a"/*图例(legend)的颜色,不是图例说明文字的颜色*/
     }
   },
   areaStyle: {
     normal: {
       color: new echarts.graphic.LinearGradient(
         0, 0, 0, 1,
         [
           { offset: 0, color: '#ff6f4a' },
           /* {offset: 0.5, color: '#c4e1ff'},*/
           { offset: 1, color: '#ecf5ff' }
         ]
       )
     }
   },
   symbol: "none",/*去掉小圆点*/
   name: '当前流量',
   type: 'line',
   data: yAxisData/*,
    smooth:true//显示为平滑的曲线*/
 }
};
实时动态
 	var totalFlowRate = echarts.init(document.getElementById('totalFlowRate'));
    var xAxisData=[];
    var yAxisData=[];
    for(var i=100 ;i>0;i--){
        xAxisData.push(i+"秒前");
    }
    for(i=1;i<101;i++){
        yAxisData.push(Math.round(Math.random()*1000));
    }
    setInterval(function(){
        yAxisData.push(Math.round(Math.random()*1000));
        yAxisData.shift();
        var totalFlowRateOption = {
            animation:false,
            title: {
                text: '总流量(kbps)'/*,
                 left:"110px"*/
            },
            tooltip: {
                trigger: 'axis',
                axisPointer: {
                    type: 'cross'
                }
            },
            grid: {
                left: 50/*"50px"*/,
                right: 15/*"15px"*/
            },
            legend: {
                data:['当前流量'],
                textStyle:{color:"#66b3ff"}/*图例(legend)说明文字的颜色*/
            },
            xAxis: {
                boundaryGap: false,
                data: xAxisData,
                splitLine:{show: true}/*网格线*/
            },
            yAxis: {
                boundaryGap:false,
                splitLine:{show: true}/*网格线*/
            },
            series: {
              /*itemStyle: {normal: {areaStyle: {type: 'default'}}},*/
              itemStyle : {
                normal : {
                  lineStyle:{
                    color:'#92c2ff'/*折线的颜色*/
                  },
                  color:"#66b3ff"/*图例(legend)的颜色,不是图例说明文字的颜色*/
                }
              },
              areaStyle: {normal: {
                color: new echarts.graphic.LinearGradient(
                  0, 0, 0, 1,
                  [
                    {offset: 0, color: '#66b3ff'},
                   /* {offset: 0.5, color: '#c4e1ff'},*/
                    {offset: 1, color: '#ecf5ff'}
                  ]
                )
              }},
              symbol:"none",/*去掉小圆点*/
              name: '当前流量',
              type: 'line',
              data: yAxisData/*,
               smooth:true//显示为平滑的曲线*/
            }
        };
        totalFlowRate.setOption(totalFlowRateOption);
    },100);
最后最贡献一个拖拽条的样式
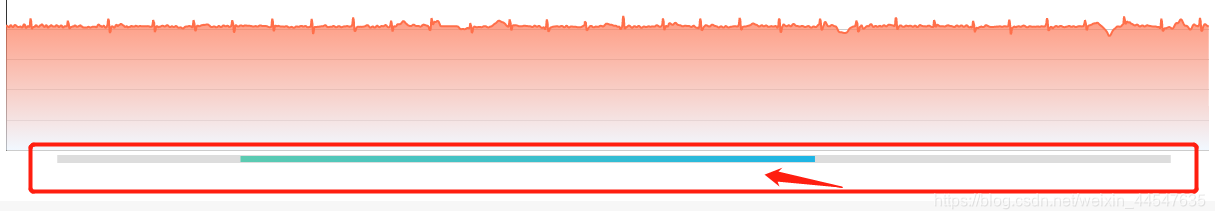
  dataZoom: [   //给x轴设置滚动条
      {
          start:0,//默认为0
          end: 100-1500/31,//默认为100
          type: 'slider',
          show: true,
          xAxisIndex: [0],
          handleSize: 0,//滑动条的 左右2个滑动条的大小
          height: 8,//组件高度
          left: 50, //左边的距离
          right: 40,//右边的距离
          bottom: 26,//右边的距离
          handleColor: '#ddd',//h滑动图标的颜色
          handleStyle: {
              borderColor: "#cacaca",
              borderWidth: "1",
              shadowBlur: 2,
              background: "#ddd",
              shadowColor: "#ddd",
          },
          fillerColor: new echarts.graphic.LinearGradient(1, 0, 0, 0, [{
              //给颜色设置渐变色 前面4个参数,给第一个设置1,第四个设置0 ,就是水平渐变
              //给第一个设置0,第四个设置1,就是垂直渐变
              offset: 0,
              color: '#1eb5e5'
          }, {
              offset: 1,
              color: '#5ccbb1'
          }]),
          backgroundColor: '#ddd',//两边未选中的滑动条区域的颜色
          showDataShadow: false,//是否显示数据阴影 默认auto
          showDetail: false,//即拖拽时候是否显示详细数值信息 默认true
          handleIcon: 'M-292,322.2c-3.2,0-6.4-0.6-9.3-1.9c-2.9-1.2-5.4-2.9-7.6-5.1s-3.9-4.8-5.1-7.6c-1.3-3-1.9-6.1-1.9-9.3c0-3.2,0.6-6.4,1.9-9.3c1.2-2.9,2.9-5.4,5.1-7.6s4.8-3.9,7.6-5.1c3-1.3,6.1-1.9,9.3-1.9c3.2,0,6.4,0.6,9.3,1.9c2.9,1.2,5.4,2.9,7.6,5.1s3.9,4.8,5.1,7.6c1.3,3,1.9,6.1,1.9,9.3c0,3.2-0.6,6.4-1.9,9.3c-1.2,2.9-2.9,5.4-5.1,7.6s-4.8,3.9-7.6,5.1C-285.6,321.5-288.8,322.2-292,322.2z',
          filterMode: 'filter',
      },
      //下面这个属性是里面拖到
      {
          type: 'inside',
          show: true,
          xAxisIndex: [0],
          start: 0,//默认为1
          end: 100-1500/31,//默认为100
      },
  ],